
The unfold toolbox allows to model linear overlaps in between multiple events in EEG data. For example stimulus onsets and keypresses or subsequent fixation onsets in free-viewing. In addition we allow for non-parametric predictors, thus many (unknown and nonlinear) relations can be modelled in a flexible way.
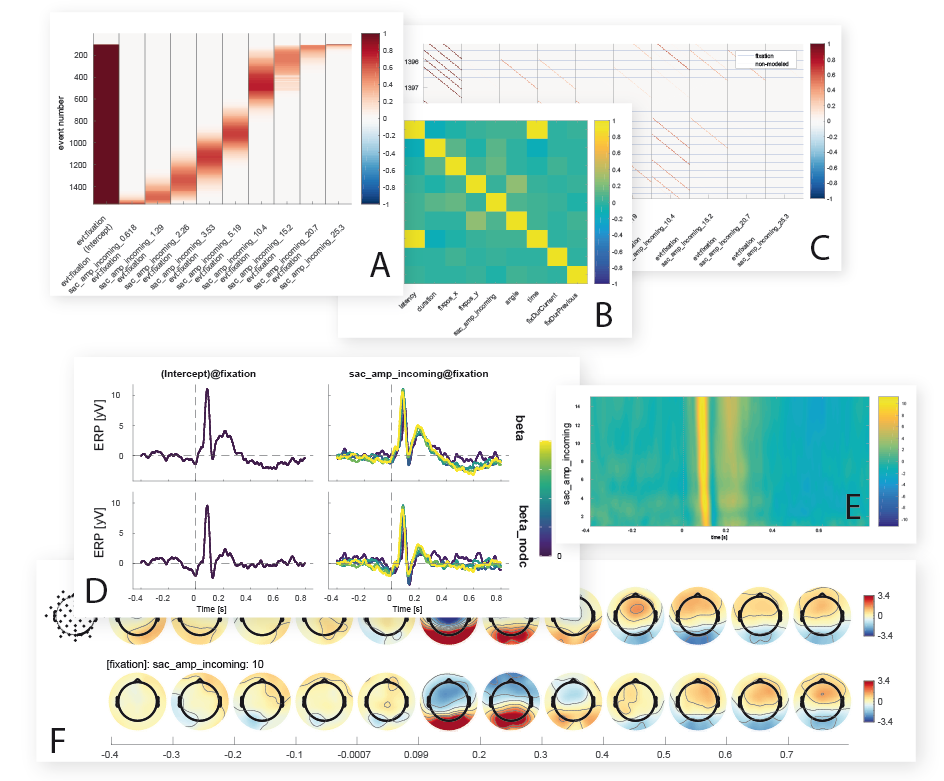
All of these visualization examples are direct outputs from the toolbox. (A) Design matrix with splines. (B) Correlation between EEG.events. (C) Time-expanded design matrix. (D) Convolution vs. no-convolution for fixation and non-linear saccade amplitude effect. (E) 2D-Plot of time against saccade amplitude. (F) Topoplots for saccade amplitude effect over time at two different saccade amplitudes.